Project 3H: Working with hierarchical / multilevel data
Research Area: Statistics
Classification: Data analysis
Lots of real world data have a hierarchical or clustered structure: children are grouped within schools, patients within hospitals, families within neighbourhoods (within regions, within countries etc.).
It is reasonable to expect that children within the same school (for example) might be more similar to one another in some ways than children from different schools. This might be because of how the schools select or admit students, or it might be a result of each school’s individual culture or governance. However it comes about, this hierarchical structure makes a lot of the statistical methods you’ve learned about so far invalid, because they rely on the assumption that data are independently and identically distributed.
In this project, we’ll look at how to understand and analyse these sorts of datasets.
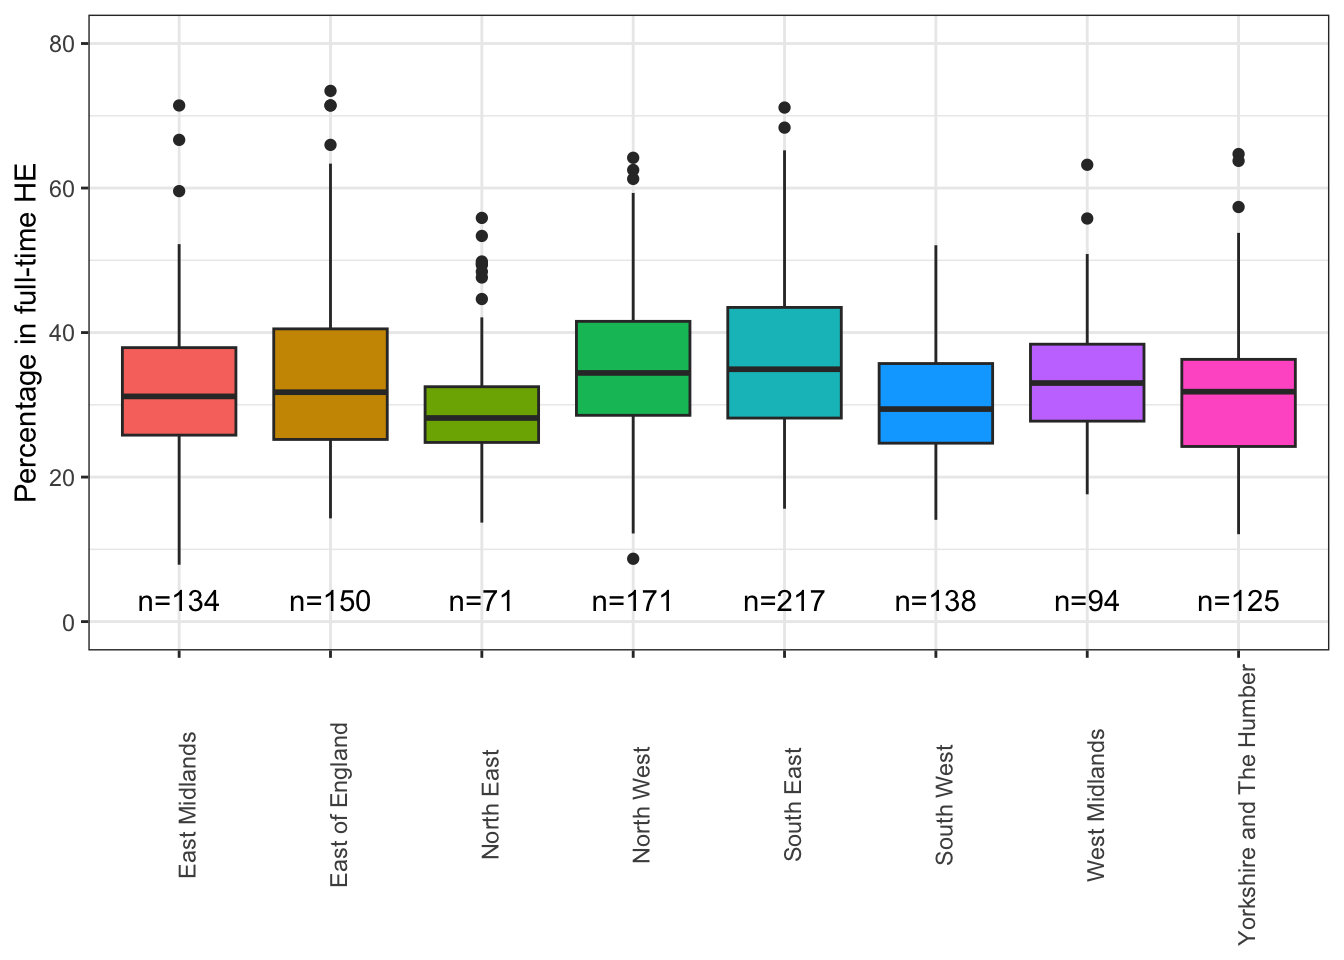
Example: full time education at age 19
The plot below shows the percentage of 19 year-olds who completed KS4 (GCSEs) in 2012-13 who were in in full time further education in 2016-17, for 1100 English towns / cities (clustered within regions).
For each town we also have information like the index of multiple deprivation, the size of the town, whether it has a university and so on. It may be that some of these covariates explain some of the variation between regions. (Whether we could, in theory, gather enough information to remove all the between-region variation is an interesting question.)
If we wanted to predict the percentage of 19 year-olds in full-time education for another town in one of these regions, we would expect it to fall somewhere within the distribution of the towns in our sample. If we wanted to predict the percentage for a town in a new region we have less information, but we can still use the structure of the data to help us.
The structure of the data means we have to be more careful in our modelling approach. For example, suppose we want to understand the effect of the presence of a university in the town. If we ignore the hierarchical nature of the data, our estimates of this effect will be inaccurate.
Group Project
In the group project phase, we’ll focus on learning the basic and fundamental concepts necessary to work with hierarchical datasets. By the end, we will have covered:
- Intracluster correlation
- Fixed effects and random effects
- The basic two-level model
- Working with hierarchical data in R
Mode of operation and evidence of learning for group project
This project will involve a combination of learning new theory and methodology (from books, articles etc.) and applying it to datasets (either real or synthetic). Students will demonstrate their understanding by clearly communicating what they have learned in both written and oral formats, and by insightful interpretation of any examples or case studies.
Individual project
Having established the core principles, in the individual project you will be able to pursue a more advanced aspect of the topic. Some possible directions you could take include
- Longitudinal data (repeated measures of the same subject)
- Hierarchical data with a discrete response variable
- Multivariate multilevel models - multiple response variables ‘clustered’ within the same individual
- Three-level models and more complex hierarchical structures
- Bayesian approaches to hierarchical modelling
- A case study of a particular, complex dataset
Mode of operation and evidence of learning for individual project
This project will involve a combination of learning new theory and methodology (from books, articles etc.) and applying it to datasets (either real or synthetic). Students will demonstrate their understanding by clearly communicating what they have learned in both written and oral formats, and by insightful interpretation of any examples or case studies.
NoteResources
These three books each provide great coverage of the topic, and all are available online. You may have to log in to the library for these links to work.
NotePrerequisites and co-requisites
Data Science & Statistical Modelling II Desirable: Advanced Statistical Modelling III
If you have any questions, feel free to email me: r.h.oughton@durham.ac.uk.